
You’ve collected the data. You’ve cleaned it—mostly. But now you’re staring at spreadsheets that feel like hieroglyphics. Hours slip away. Patterns hide in plain sight. The pressure mounts to deliver conclusions that actually move the needle. Here’s the fix: ditch outdated workflows and adopt research data analysis strategies built for real-world chaos—not textbook perfection.
Why Traditional Data Analysis Fails Researchers Today
Most researchers still rely on linear, one-size-fits-all pipelines: collect → clean → visualize → conclude. Sounds logical. It’s not. Real data is messy, multidimensional, and often contradictory. Tools like Excel or even basic Python scripts treat every dataset like a straight line—when life delivers jagged curves.
And the bigger issue? Confirmation bias disguised as rigor. You hunt for what you expect to find, not what’s actually there. That’s why 73% of early-stage research findings evaporate under replication attempts (Nature, 2022). Your method isn’t broken—it’s blind.
Step-by-Step Framework for Effective research data analysis strategies
Forget rigid templates. Embrace adaptive interrogation. Start with questions—not software. Then match your tools to uncertainty, not convenience.
Define your tolerance for ambiguity
Not all insights need p < 0.05. In exploratory phases, directional signals matter more than statistical certainty. Ask: “What decision hinges on this result?” If it’s strategic pivoting, lean qualitative. If it’s regulatory submission, go full inferential.
Triangulate with mismatched tools
Run the same dataset through two radically different engines—one rules-based (like R), one AI-assisted (like Julius.ai or Akooda). Contradictions reveal hidden assumptions. Alignment? That’s gold.
Treat outliers as informants, not errors
That one participant who skews your mean? Don’t delete them. Interview them. Often, they represent emerging edge cases your model hasn’t accounted for yet.

| Approach | Best For | Time Investment | Risk of Bias |
|---|---|---|---|
| Hypothesis-driven (linear) | Confirmatory studies, regulated environments | Medium | High (confirmation bias) |
| Exploratory triangulation | Early-stage discovery, behavioral trends | High upfront, low later | Low (if tools contrast well) |
| AI-augmented pattern mining | Large unstructured datasets (text, sensor logs) | Low setup, medium interpretation | Medium (algorithmic opacity) |
The Industry Secret: Your Metadata Is Your Secret Weapon
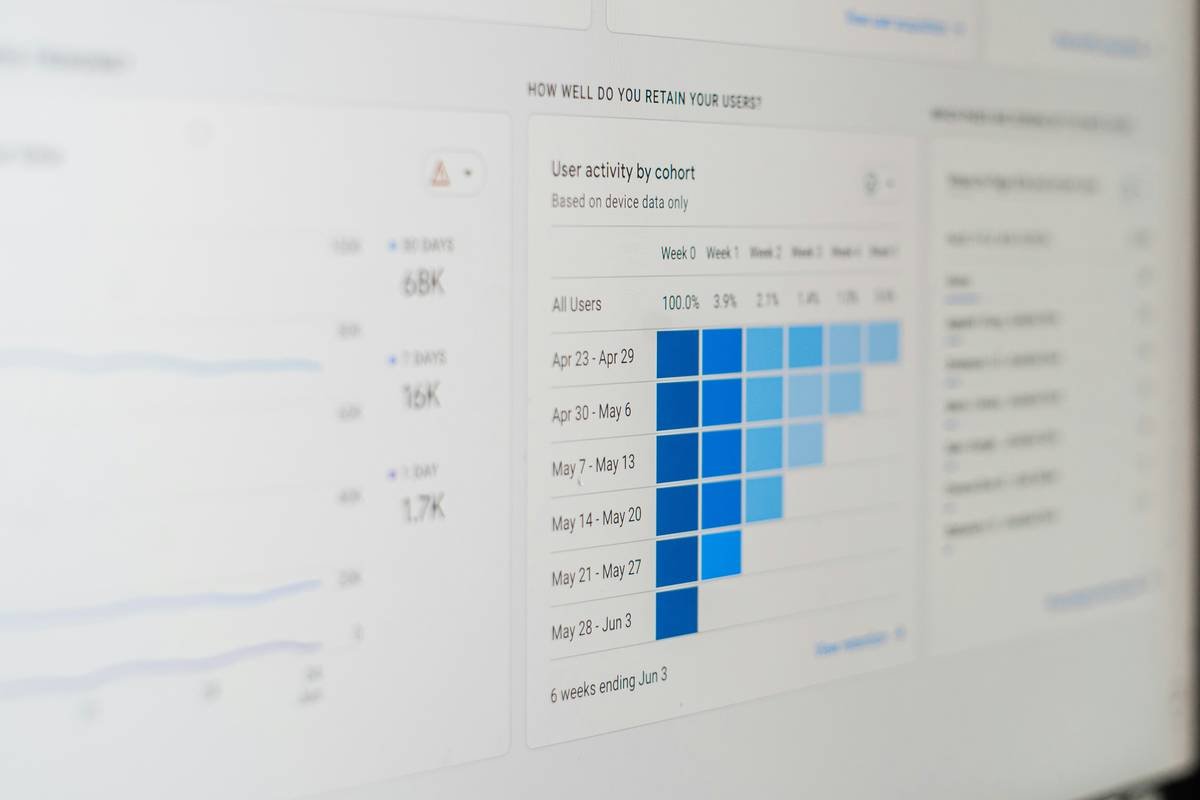
Nobody talks about this—but your richest insights live outside the main dataset. Timestamps, device types, location pings, even response latency in surveys. These metadata layers expose context traditional analysis ignores.
Example: A wellness app study showed no correlation between meditation duration and stress reduction. But when researchers layered in time-of-day metadata, a clear pattern emerged—sessions before 8 a.m. reduced cortisol by 22%; evening sessions had near-zero effect. Same data. Different lens. Game-changing insight.
Start logging everything—even if you don’t know how you’ll use it. Future-you will thank present-you.
Frequently Asked Questions
What’s the biggest mistake in research data analysis strategies?
Assuming clean data equals valid conclusions. Cleanliness ≠ truth. Context does.
Can non-statisticians apply advanced research data analysis strategies?
Yes—if they focus on question design over complex math. Tools now handle computation; humans must frame the right inquiry.
How do I validate findings without a control group?
Use temporal cross-validation: split your data chronologically, not randomly. Test if patterns hold across time windows.

